Page 53 - European Energy Innovation - Autumn 2014
P. 53
Autumn 2014 European Energy Innovation 53
PHOTOVOLTAICS
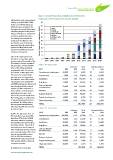
photovoltaic solar energy targets, Figure 2 Annual Photovoltaic Installations from 2004 to 2014
adding up to 84.5 GW in 2020. (data source: EPIA2, Eurobserver3 and JRC analysis)
At the end of 2014, this target
will have been reached for the 50
European Union and the absence
of binding targets for the period Annual Photovoltaic Installations [GWp] 45 Rest of Europe
beyond 2020 give no investment Italy
security to potential investors.
The driving force behind the 40 Spain
anticipated installations is the Germany
fact that the cost of electricity
generated by solar photovoltaic 35 Rest of World
systems is falling below retail China
prices for residential and small
commercial customers. 30 United States
Japan
One of the consequences are
the effects on local jobs and the 25
local economy: The growth of the
PV industry in Europe resulted in 20
the generation of over 260 000
jobs or 38% of the worldwide 15
employment in the PV sector in
2011 (Table 1). Most jobs in the 10
PV sector were created in the
two main areas of construction 5
& installation and cell & module
manufacturing. To calculate the 0
jobs/MW, employment figures and 2004 2005 2006 2007 2008 2009 2010 2011 2012 2013 2014e
annual output stated in annual
reports of public companies as Table 1: PV Jobs in 2011 MW Jobs per Total European Share
well as private communications 42,000 MW Jobs % Jobs
with private ones were used. 2011
Jobs in the general supply chain Operation and maintenance 7,000 0.15 6,300 70 4,410
like mining, glass manufacturing Construction 20,000 70 15,680
or general equipment were not Installation 31,000 3.20 22,400 70 137,200
considered. In addition jobs in Polysilicon 25 5,810
the equipment manufacturing Cell and Module 9.80 196,000
industry and public R&D are not manufacturing 10 33,600
included as well. Inverters 0.75 23,250
Balance of plants 60 24,300
In 2011, the European share of Project development 35,000 9.60 336,000 70 34,020
PV related jobs was about 38%. Financial services 50 3,150
More than 75% of the 260,000 TOTAL 27,000 1.50 40,500 70 1,890
jobs were related to operating 27,000 1.80 48,600 38 260,060
and installing solar photovoltaic 14,000 0.45 6,300
electricity systems. Almost all of 27,000 0.10 2,700
these jobs were local European
jobs contributing to the European 682,050
gross national product. The steep
drop in new installations from Table 2: PV Jobs in 2013 MW Jobs per Total European Share
2011 to 2013 has more than 100,000 MW Jobs % Jobs
halved these local jobs and with 2013
it the positive effect on the local Operation and maintenance 18,000 0.15 15.000 57 7,350
European economy. Construction 20,000 20 11,520
Installation 40,000 3.20 57,600 30 53,400
In addition, the contracting Polysilicon 25 5,000
Cell and Module 42,000 8.90 178,000
manufacturing 38,000 5 16,800
Inverter 38,000 0.50 20,000 40 19,760
Balance of plants 36,000 30 16,650
Project development 38,000 8.00 336,000 35 2,450
Financial services 1.3 49,400 35 1,300
TOTAL 1.5 55,500 19 134,230
0.35 7,000
0.10 3,700
722,200
www.europeanenergyinnovation.eu
PHOTOVOLTAICS
photovoltaic solar energy targets, Figure 2 Annual Photovoltaic Installations from 2004 to 2014
adding up to 84.5 GW in 2020. (data source: EPIA2, Eurobserver3 and JRC analysis)
At the end of 2014, this target
will have been reached for the 50
European Union and the absence
of binding targets for the period Annual Photovoltaic Installations [GWp] 45 Rest of Europe
beyond 2020 give no investment Italy
security to potential investors.
The driving force behind the 40 Spain
anticipated installations is the Germany
fact that the cost of electricity
generated by solar photovoltaic 35 Rest of World
systems is falling below retail China
prices for residential and small
commercial customers. 30 United States
Japan
One of the consequences are
the effects on local jobs and the 25
local economy: The growth of the
PV industry in Europe resulted in 20
the generation of over 260 000
jobs or 38% of the worldwide 15
employment in the PV sector in
2011 (Table 1). Most jobs in the 10
PV sector were created in the
two main areas of construction 5
& installation and cell & module
manufacturing. To calculate the 0
jobs/MW, employment figures and 2004 2005 2006 2007 2008 2009 2010 2011 2012 2013 2014e
annual output stated in annual
reports of public companies as Table 1: PV Jobs in 2011 MW Jobs per Total European Share
well as private communications 42,000 MW Jobs % Jobs
with private ones were used. 2011
Jobs in the general supply chain Operation and maintenance 7,000 0.15 6,300 70 4,410
like mining, glass manufacturing Construction 20,000 70 15,680
or general equipment were not Installation 31,000 3.20 22,400 70 137,200
considered. In addition jobs in Polysilicon 25 5,810
the equipment manufacturing Cell and Module 9.80 196,000
industry and public R&D are not manufacturing 10 33,600
included as well. Inverters 0.75 23,250
Balance of plants 60 24,300
In 2011, the European share of Project development 35,000 9.60 336,000 70 34,020
PV related jobs was about 38%. Financial services 50 3,150
More than 75% of the 260,000 TOTAL 27,000 1.50 40,500 70 1,890
jobs were related to operating 27,000 1.80 48,600 38 260,060
and installing solar photovoltaic 14,000 0.45 6,300
electricity systems. Almost all of 27,000 0.10 2,700
these jobs were local European
jobs contributing to the European 682,050
gross national product. The steep
drop in new installations from Table 2: PV Jobs in 2013 MW Jobs per Total European Share
2011 to 2013 has more than 100,000 MW Jobs % Jobs
halved these local jobs and with 2013
it the positive effect on the local Operation and maintenance 18,000 0.15 15.000 57 7,350
European economy. Construction 20,000 20 11,520
Installation 40,000 3.20 57,600 30 53,400
In addition, the contracting Polysilicon 25 5,000
Cell and Module 42,000 8.90 178,000
manufacturing 38,000 5 16,800
Inverter 38,000 0.50 20,000 40 19,760
Balance of plants 36,000 30 16,650
Project development 38,000 8.00 336,000 35 2,450
Financial services 1.3 49,400 35 1,300
TOTAL 1.5 55,500 19 134,230
0.35 7,000
0.10 3,700
722,200
www.europeanenergyinnovation.eu