Page 69 - European Energy Innovation - Autumn 2014
P. 69
Autumn 2014 European Energy Innovation 69
POLAND
Table 2. Final energy saving targets and final energy savings achieved
Final energy saving targets Final energy savings achieved in 2010 and
savings planned to be achieved in 2016
I ktoe In %, in relation ktoe In %, in relation to the
to the average average consumption in
consumption in 2001-2005
2001-2005
2010 1020 2 4725 9,3
2016 4596 9 7085 13,9
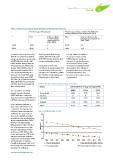
resulted in observed decreasing, Table 3 presents final energy The top-down calculations
with the exception of year 2010, savings achieved in the years of energy savings and by
primary and final energy intensity 2010-2012, broken down by final ODEX indicate significant
of GDP (Fig. 2). In the first half energy consumption sectors. increase of energy efficiency
of the decade, energy intensity of economy. There is a role
decreased by over 2% per year, On the base of ODEX the of measures implemented by
in years 2006-2009 the rate of calculations of energy savings and government, also influences
improvement exceeded 5% in its prediction for next years was positively awareness of society
case of primary intensity, and executed. The calculations confirm showing importance and
amounted to nearly 4% in final the top-down results and proved benefits of decreasing energy
energy intensity. In years 2009- Poland progress in the field. consumption.
2011 the rate of improvement has
fallen (2010 the energy intensity Table 3. Achieved final energy savings by sectors
of Polish intensity increased first
time in many years). Sector Achieved final energy savings (GWh)
The calculations of energy Households 2010 2011 2012
savings executed by using Services
ODEX indicators confirm the Transport 1458 1192 1863
improvement of energy efficiency 0 0 0
of Polish economy and its sectors.
1525 1247 2162
ODEX indicator declined in
years 2002-2012 from 91.8 to Industry 1742 2185 2317
71.6 points. The average rate Total 4725 4625 63422
of improvement amounted to
2.5%/year. The fastest rate of Fig. 2. Energy intensity of GDP
improvement (4.8% annually)
was achieved by manufacturing. 0,6
In the household sector ODEX
indicator was dynamically 0,5
falling until year 2003, then the
rate of improvement was little. kgoe/euro00 0,4
Average annual improvement
in the years 2002-2012 in this 0,3
sector amounted to 1.7%. In the
transport sector, the indicator 0,2 2003 2004 2005 2006 2007 2008 2009 2010 2011 2012
remained at similar level to 2004 2002 Primary intensity with climatic correction
and then began to decline. Final intensity with climatic correction
Overall in the period 2002-2012 Primary energy intensity
the average rate of improvement
amounted to 1.6%/year. Final energy intensity
www.europeanenergyinnovation.eu
POLAND
Table 2. Final energy saving targets and final energy savings achieved
Final energy saving targets Final energy savings achieved in 2010 and
savings planned to be achieved in 2016
I ktoe In %, in relation ktoe In %, in relation to the
to the average average consumption in
consumption in 2001-2005
2001-2005
2010 1020 2 4725 9,3
2016 4596 9 7085 13,9
resulted in observed decreasing, Table 3 presents final energy The top-down calculations
with the exception of year 2010, savings achieved in the years of energy savings and by
primary and final energy intensity 2010-2012, broken down by final ODEX indicate significant
of GDP (Fig. 2). In the first half energy consumption sectors. increase of energy efficiency
of the decade, energy intensity of economy. There is a role
decreased by over 2% per year, On the base of ODEX the of measures implemented by
in years 2006-2009 the rate of calculations of energy savings and government, also influences
improvement exceeded 5% in its prediction for next years was positively awareness of society
case of primary intensity, and executed. The calculations confirm showing importance and
amounted to nearly 4% in final the top-down results and proved benefits of decreasing energy
energy intensity. In years 2009- Poland progress in the field. consumption.
2011 the rate of improvement has
fallen (2010 the energy intensity Table 3. Achieved final energy savings by sectors
of Polish intensity increased first
time in many years). Sector Achieved final energy savings (GWh)
The calculations of energy Households 2010 2011 2012
savings executed by using Services
ODEX indicators confirm the Transport 1458 1192 1863
improvement of energy efficiency 0 0 0
of Polish economy and its sectors.
1525 1247 2162
ODEX indicator declined in
years 2002-2012 from 91.8 to Industry 1742 2185 2317
71.6 points. The average rate Total 4725 4625 63422
of improvement amounted to
2.5%/year. The fastest rate of Fig. 2. Energy intensity of GDP
improvement (4.8% annually)
was achieved by manufacturing. 0,6
In the household sector ODEX
indicator was dynamically 0,5
falling until year 2003, then the
rate of improvement was little. kgoe/euro00 0,4
Average annual improvement
in the years 2002-2012 in this 0,3
sector amounted to 1.7%. In the
transport sector, the indicator 0,2 2003 2004 2005 2006 2007 2008 2009 2010 2011 2012
remained at similar level to 2004 2002 Primary intensity with climatic correction
and then began to decline. Final intensity with climatic correction
Overall in the period 2002-2012 Primary energy intensity
the average rate of improvement
amounted to 1.6%/year. Final energy intensity
www.europeanenergyinnovation.eu